Plotting data is my own form of therapy. I am happy because chemical data happens to be what I mostly play with and it’s something pure and beautiful that you can’t be angry. So I spend my free time studying art, drawing, and learning colour theory.
I would like to showcase some of the artwork and how its matured that meant the most to me as a final end to the year.
Happy New Year!
PyData Global 2022

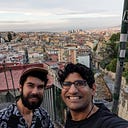
I got invited to present at PyData Global 2022 a couple weeks ago and I wanted to make something cool for them to show how python can be used on Force Fields. I decided to process 10 million molecules into a software we develop and plot the data. It’s a density relation map of atom types to each other plotted in the form of a chord diagram using d3 with a colour gradient from pink to dark blue. Different colours differentiate the type of atom pair relation.
International Society of Quantum Biology and Physics

This was one of my first pieces where I could use sun bursting diagrams over a rainbow colour scheme to sift through chemical data using specific queries of interest to select compounds. The 1,2-dithiolane is tattooed on my arm because it was my first “selected” compound to do something useful.
Chemical Diversity Filter

This was a relation map to organize data based on arbitrary classes of chemical classifications based on user questions.
- ) Does the molecule have a Ring? Two Classes: Yes or No
- ) Is it aromatic ? Two Classes Yes or No
- ) What functional groups does it have? Global-Chem (at the time we had recorded 30).
The idea was that chemical data comes in from the left and we can organize things more accurately based on a collection of questions from different people to find what we are looking for. This project did not work and I actually had to abandon this idea. Maybe one day I might revisit it again.
Global-Chem

I made this in Google Slides. I spent a lot of time writing SMILES maybe that’s actually because I was trying to forget about something else. One Sunday morning I kind of just played with how to convey the information cleanly with the most basic eye catching words. I kind of felt like it was a little bit Lord of the Rings “y” if you know what I mean.
Co-Talk With Collaborator

This one made me really happy because I have a co-worker who kind of knows how to shut me up with my crazy ideas. One day though I made this plot of a probability distribution with Plotly on something called a penalty score in Force Fields. Don’t have to get into it but she liked the colours so much and she was using it. I didn’t realize it but I was happy someone liked my art enough to use it because she thought it was pretty.
That’s all the pieces I want to highlight. Next year I plan to gather a lot more data and naturally these plots are going to change and evolve into something new. Let’s see what happens.